Crypto
•
8 mins read
•
September 16, 2021
How to Read Crypto Charts: A Guide
It’s time to master crypto charts with our guide to candlestick charts, depth charts, and market caps to make sure you maximize those returns.

If you hope to begin trading in the cryptocurrency space, you’ll need to know how to read crypto charts. While it can seem a bit overwhelming at first, this guide will break down everything you need to know to ensure you’re an expert when it comes to reading these crypto charts.
Time Frames for Crypto Charts
In whichever platform you are reviewing a crypto chart, such as Coinbase or Ethereum, you will have the option to examine a 15-minute chart, an hourly chart, 4-hour chart, or a 1-day chart. The time frame that you choose will be dependent on your personal trading style.
For instance,
intra-day traders
who open and close their positions in a single day will prefer shorter time frames like hourly, fifteen-minute, or sometimes even five-minute charts.
The most common type of chart is the 5-minute chart. On the other hand,
long-term holders
may hold their positions for weeks, months, or even years — so they will find more value in using hourly, four-hour, daily, or weekly charts.
In order to learn how to read crypto charts, knowing which time frame to focus on is key.
Cryptocurrency Market Cap
Now, the market cap of a coin is an indicator of the
. It is calculated using this formula:
Market Cap =
Total Circulating Supply \ Price of Each Token
How to Read Candlestick Charts
Now that we have all of that out of the way, let’s dive into how to read crypto charts! By far the most popular type of crypto chart out there is the Japanese candlestick chart.
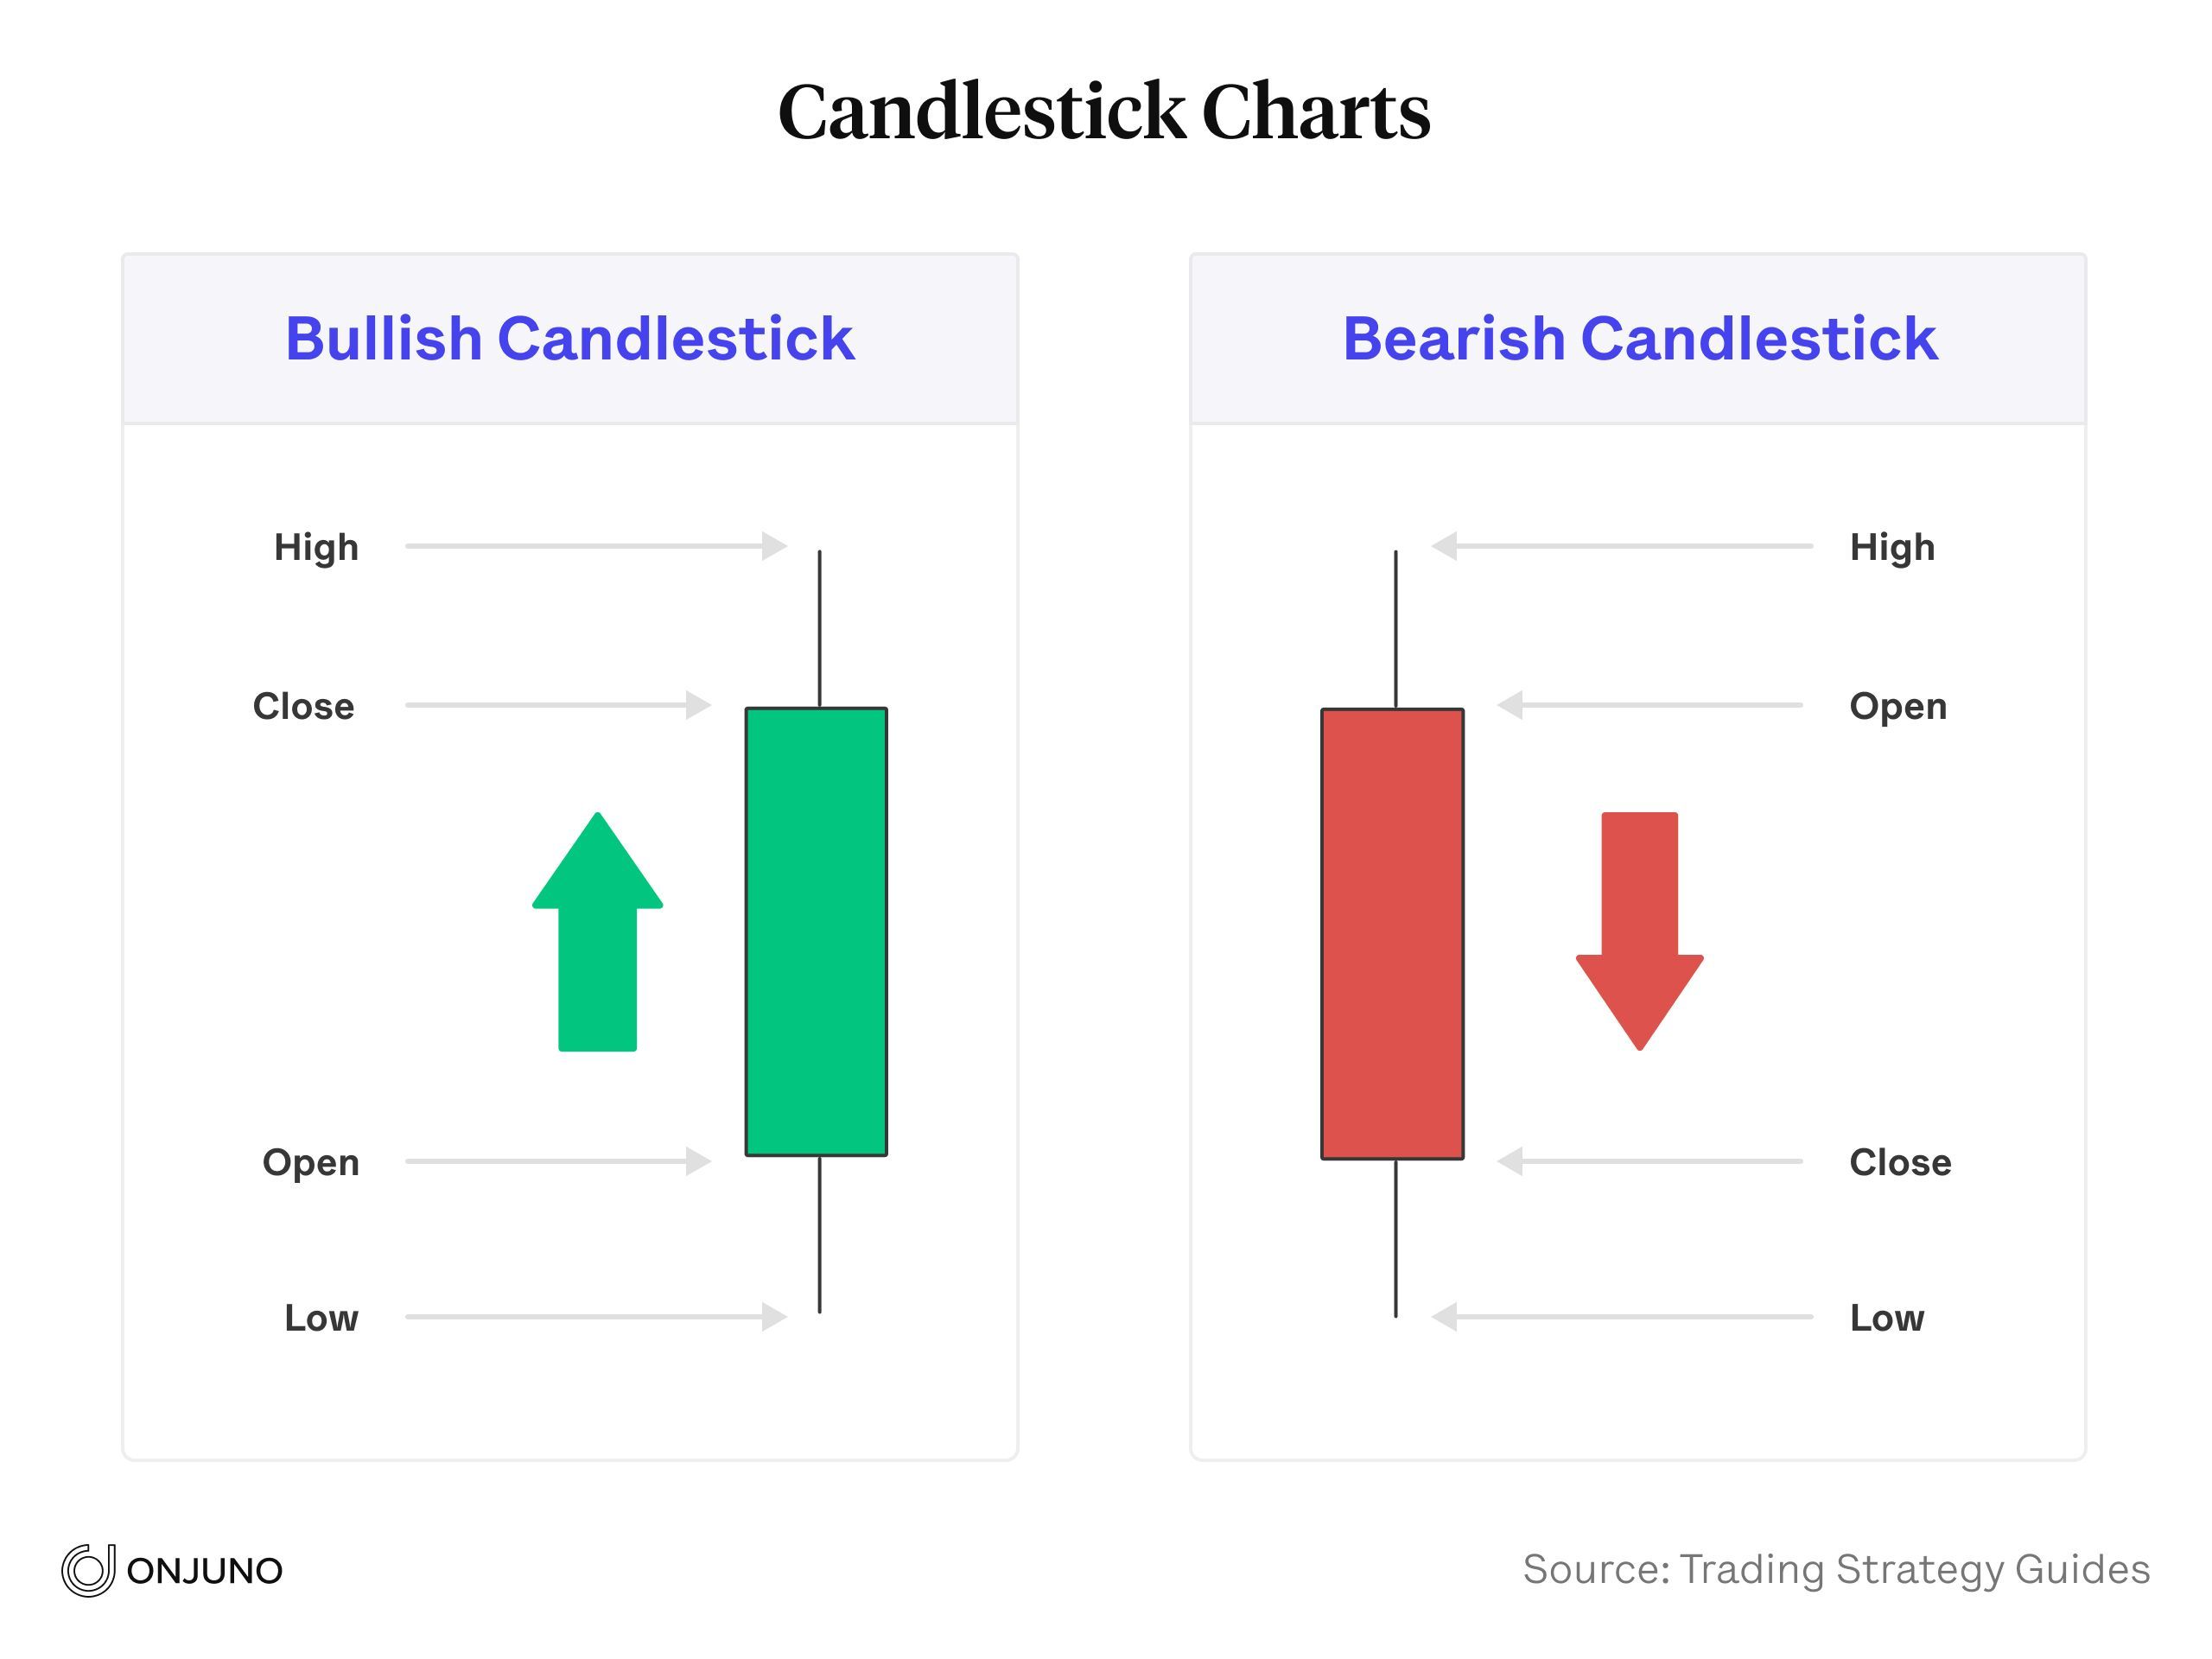
Each candle on a candlestick chart shows the price movement of the asset you are trading during a specific time interval. Now, the top whisker, which is known as a shadow, shows the highest price that the asset reached during the time interval in question, while the bottom whisker or shadow shows the lowest price that was reached during the time interval being observed. And naturally, the box, also known as the body, shows the difference between the opening and closing price of the asset during that time interval.
There are 2 types of candlesticks you will come across when reading crypto charts:
1.
Bullish:
In a bullish candlestick, the closing price is higher than the opening price of the asset, which is why it is always displayed in green.
2.
Bearish:
In a bearish candlestick, the closing price is lower than the opening price of the asset, which is why it is displayed in red.
Knowing how to read a candlestick chart can help you observe, understand, and predict market turns. While this is, of course, a high-level overview, know that you can study and learn different candlestick patterns and what they mean for the market.
Understanding both single and multiple candle patterns, as well as what the length of each wick may mean, will help you make more informed trading decisions.
How to Read Depth Charts
Knowing how to read a depth chart is another important skill when learning how to read crypto charts. Essentially, a depth chart is a tool for understanding the supply and demand of a specific asset at a given moment for a range of prices. It is a visual representation of the outstanding buy or sell orders of an asset at varying price levels.
First, though, you need to understand the following components of a depth chart:
- Bid line: This line depicts the cumulative value of all of the bids, or buy orders at a given asset price point. On a chart, it is represented by a green line sloping negatively from left to right. Note that buy orders are placed in US dollars or another fiat currency.
- Ask line: A line that represents the cumulative value of the asks, or sell orders, at each price point. On a chart, it is shown by a red line sloping negatively from right to left. Note that sell orders are only placed in the asset being traded, such as Bitcoin.
- Horizontal axis: Every price point at which buy and sell orders are being placed.
- Vertical axis: All the aggregate dollar values of the asset sell orders which are placed. The total dollar value of all buy orders is represented on the left vertical axis.
In a depth chart, the difference in the values on the x-axis gives an investor or trader insight into the liquidity and volatility of the asset in question.
This is because the aggregate value of the sell orders is stretched to correspond to the USD (or other fiat currency) values on the y-axis. However, the x-axis, though denominated in the same currency, does not always show equal values.
What this means is that if the demand and supply for the asset in question are close to equal, the x-axis will be closely aligned in value. However, if the asset is very liquid (which means more market participants are looking to sell the asset rather than buy the asset), the volume will be skewed to the right and create what is known as a
sell wall.
Similarly, if the asset is illiquid, the chart will skew left and create a
buy wall.
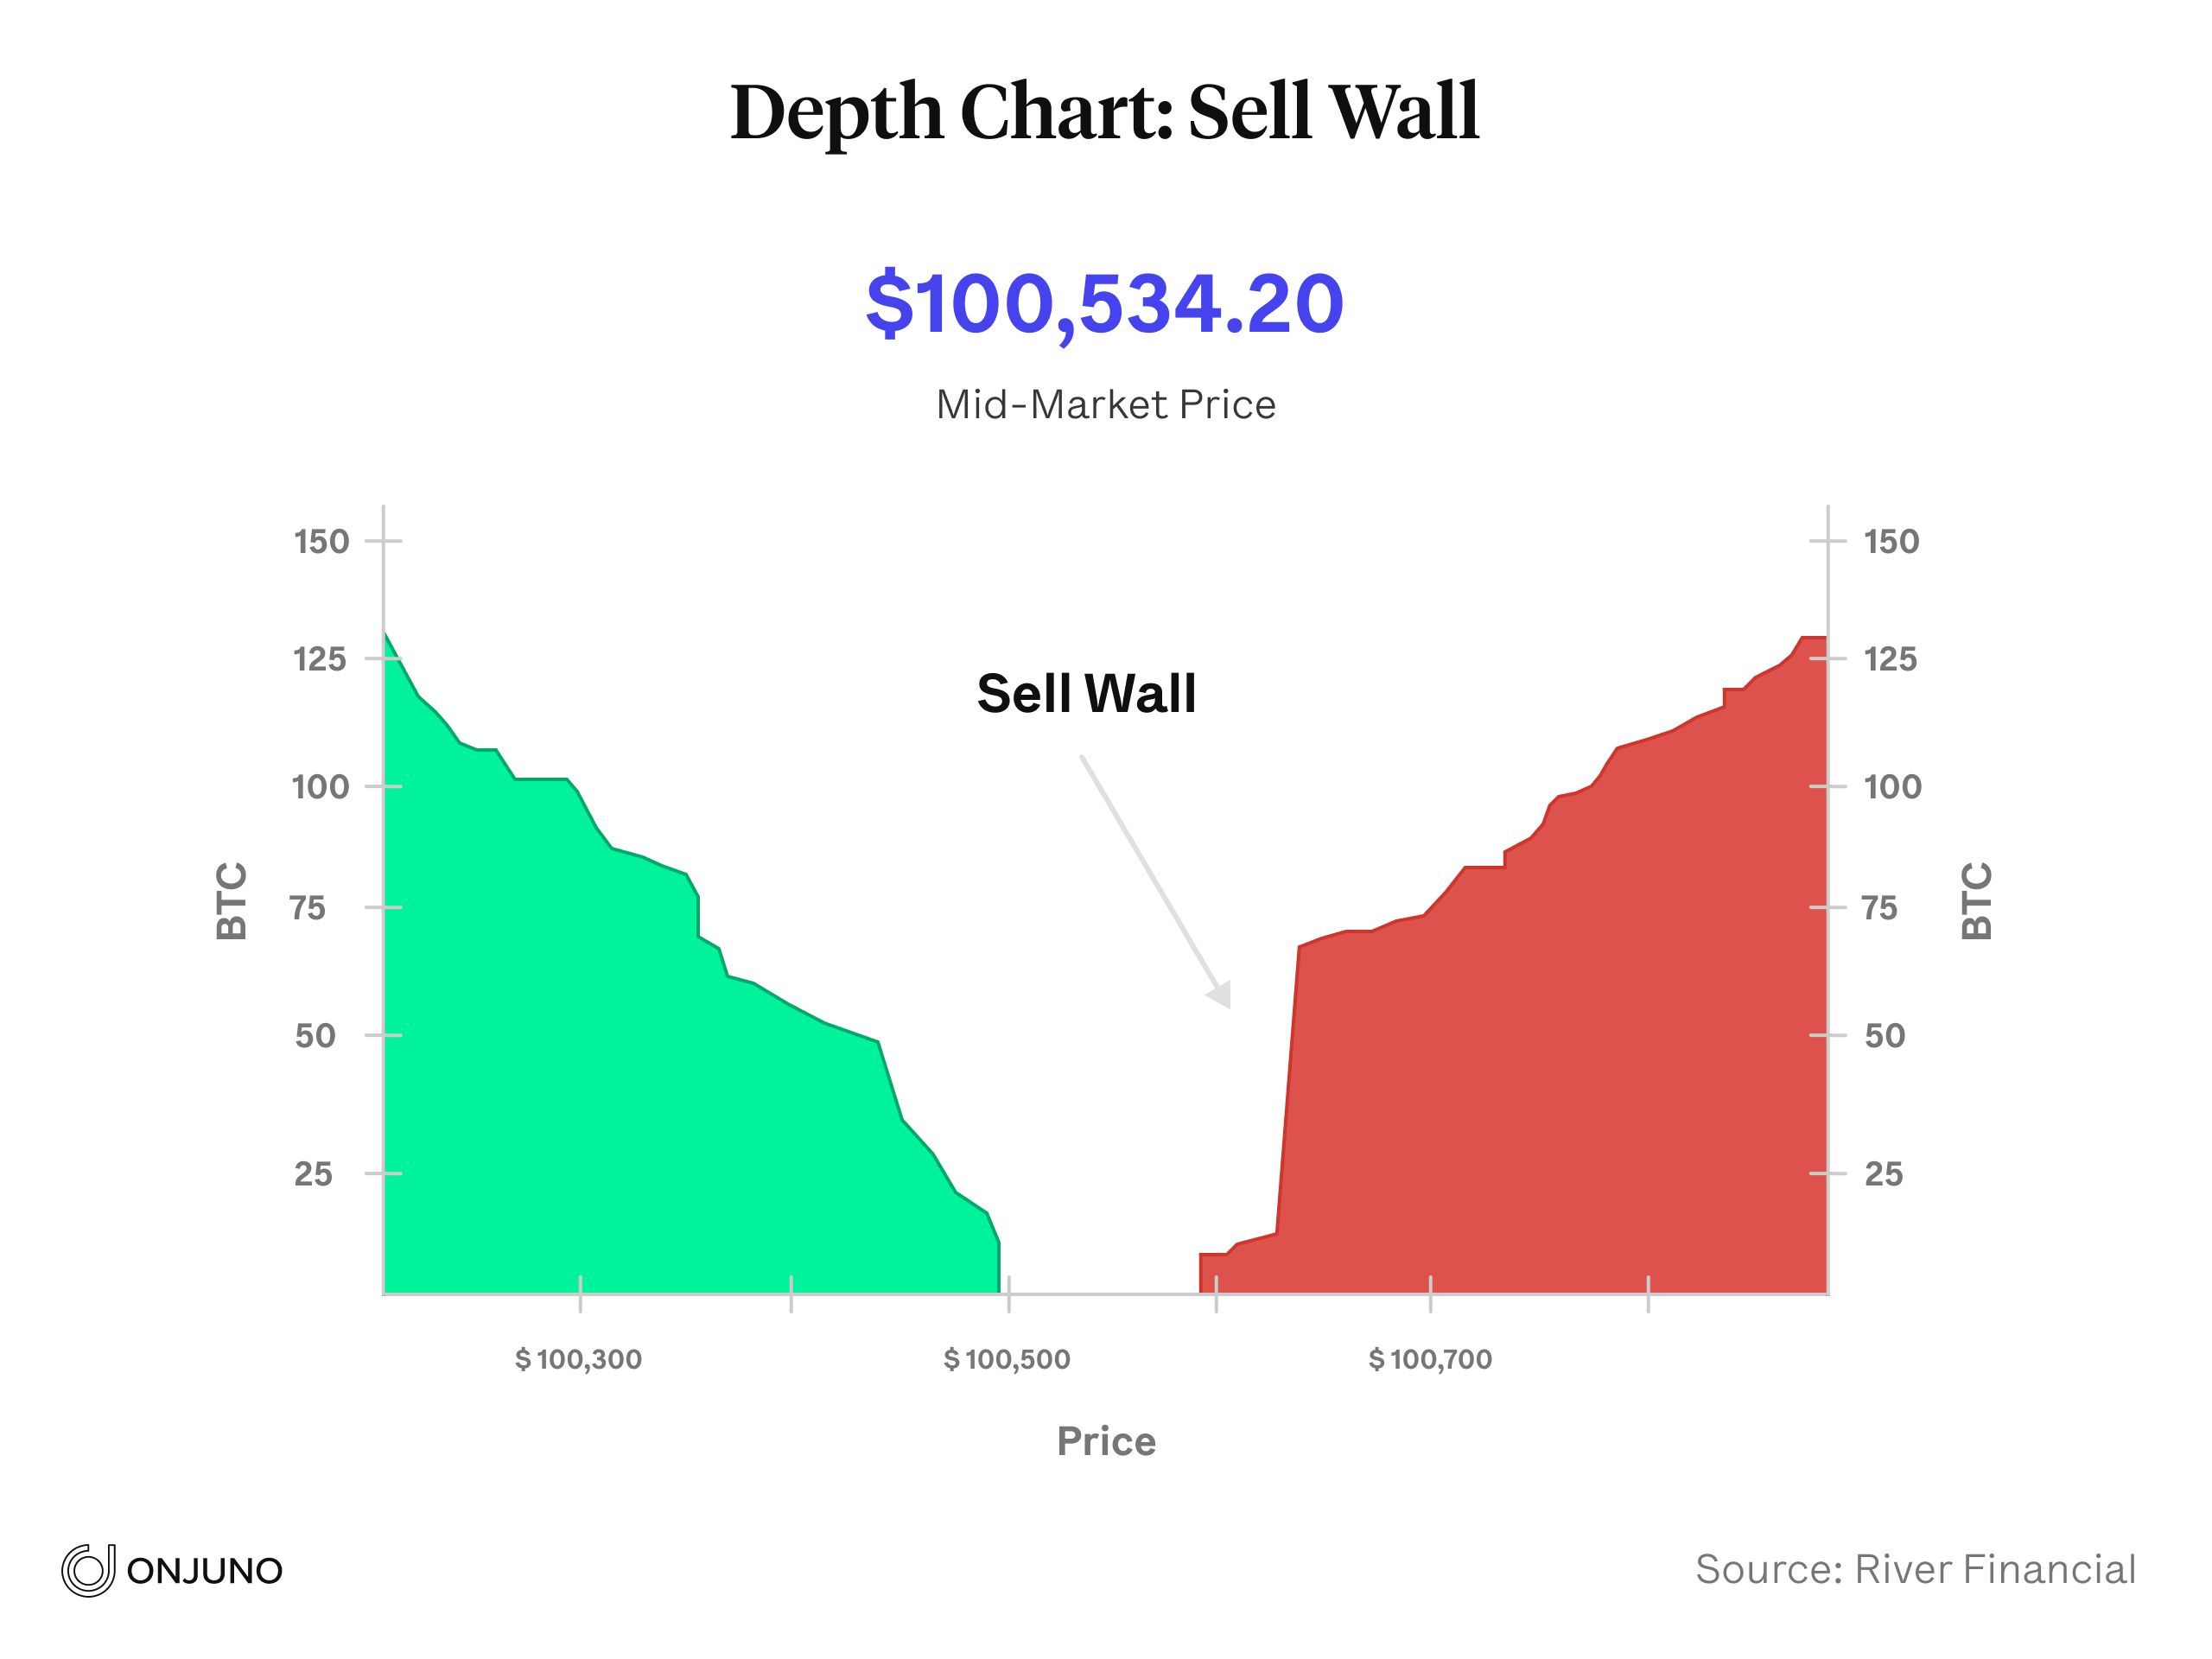
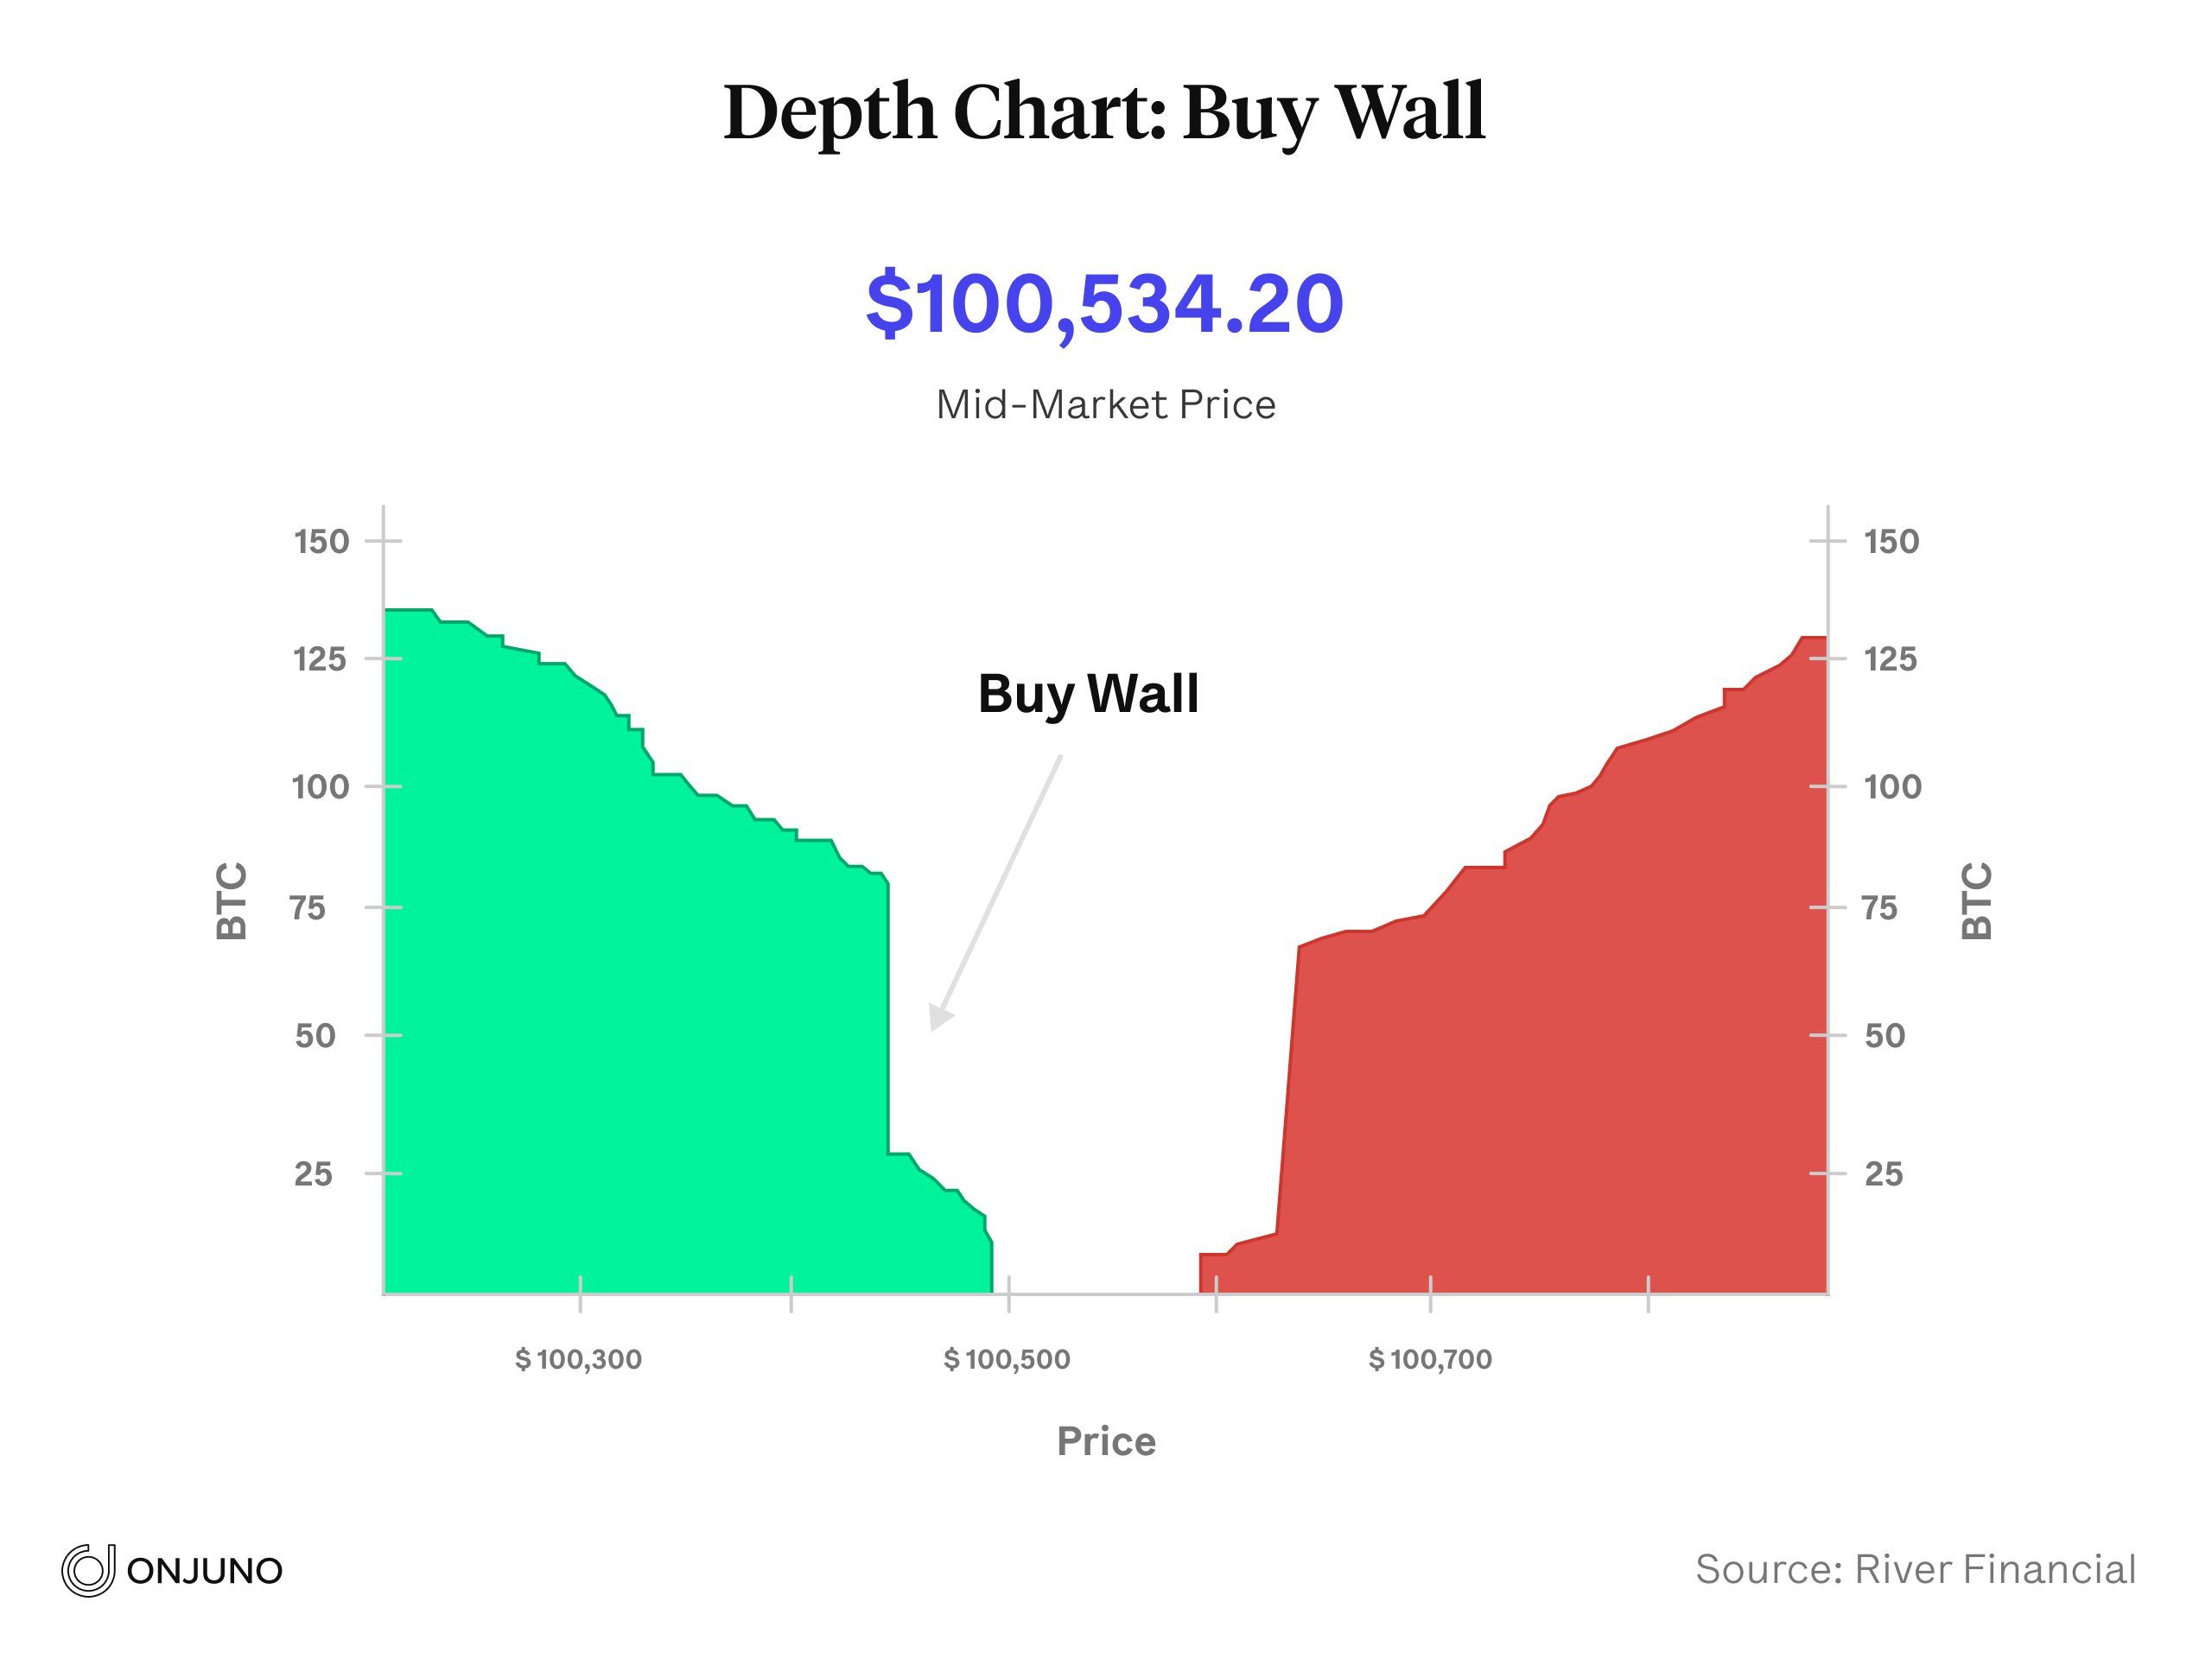
As you might have guessed, buy and sell walls can help indicate market trends and are indicators of future volatility. Essentially, they tell a trader or analyst how other participants in the market are predicting price changes. In fact, large buy or sell walls can even be created by a single trader placing a very large order.
Now, a high buy wall can indicate that traders believe the price will not fall below a certain price. Similarly, a high sell wall can indicate that many traders do not believe an asset will surpass a given price, while a low sell wall indicates that the asset price is expected to rise. Naturally, the height of these walls will influence traders to either buy or sell their asset to realize profits or avoid losses.
Bottom Line
Ultimately, learning how to read crypto charts is essential if you hope to
wisely within the cryptocurrency space. While there is far more nuance to reading these charts, you can leave that level of analysis to the experts if you’re overwhelmed. Even just familiarizing yourself with the basics will give you a leg up from those who invest in this space without ever looking at a crypto chart.